The Basic of Identifies Trend Using Moving Average
The Basic of Identifies Trend Using Moving Average
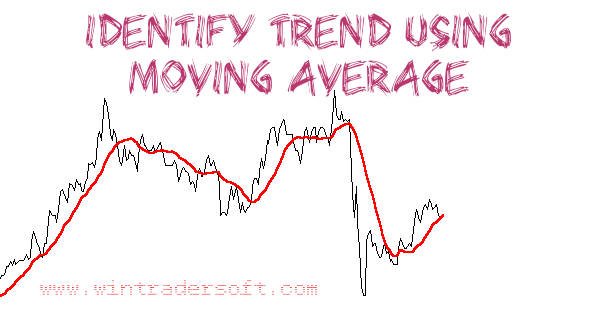
The basic of Identifies the Trend Using Moving aveage means identifying whether the market is bullish, bearish, or in a consolidation phase is utilizing moving averages. The most familiar one is the benchmark 200-day moving average. Most technicians and short term / day traders feel this is a worthless time period, with which I agree for short- to intermediate term trading. Remember that the idea in using moving averages is to help determine the true direction of the market. The longer the time period used in a moving average, the less effective it is for day trading or short term trading. Keep in mind that a 200-day moving average is over 28 weeks, more than half a year. Those leave way too much time and, more important, distance between prices and the moving average to generate buy or sell signals. When using moving averages the general guideline is simple:
- If prices are above the moving average, look to buy pullbacks or to take buy signals, as the market is in a bullish mode or in an uptrend.
- If prices are trading below the moving average, look to sell rallies or to take sell signals, as the market is bearish or in a downtrend.
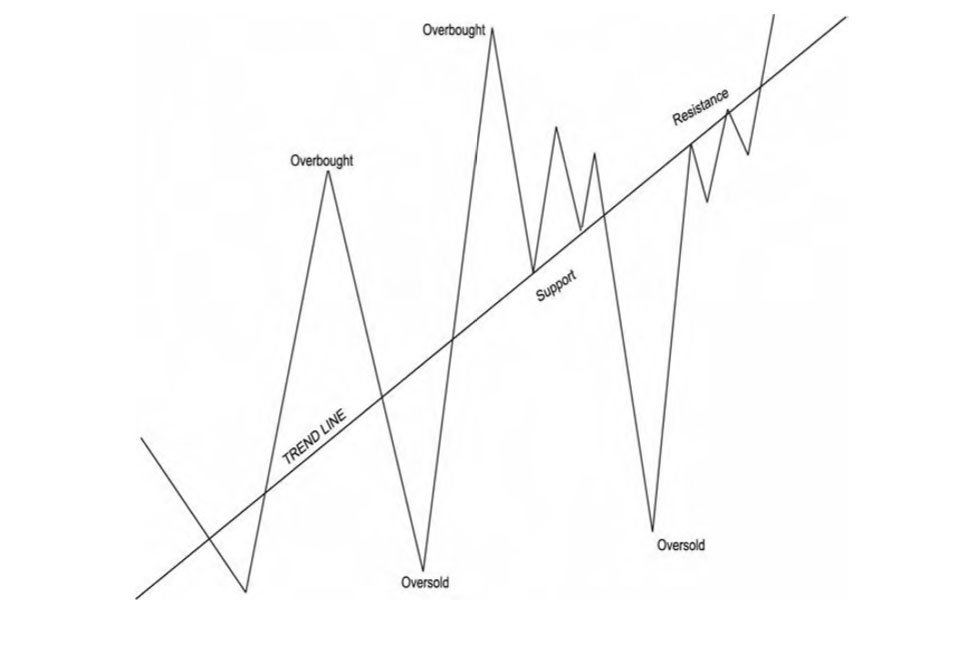
Another instance in which traders use moving averages in helping their trading is determining what is called “regression to the mean.” This is a term many traders hear but really do not understand. It refers to the condition when prices deviate too far from the mean or average. At that time, prices will regress, or return, to the average; or the market will pause or consolidate until the average catches up to the price. You will notice what I call a “gap band” signal. This is what will occur when the prices gap too far away from the moving averages or bands and give a trader an opportunity for a countertrend trade. Another way to describe this is that when a market deviates, or departs, too far from the moving average, it gives an opportunity for a speculator to take advantage of this condition, which generally ends up with prices reaching an unsustainable extreme and then returning back toward the moving averages for a short-term price swing. The question is at what distance or price level do prices deviate, or move too far away, from the moving average before market prices return to the moving average or the market pauses in order for the moving average to catch up to the prices. As you can see in Figure below, the market trends higher; but at times we see reactions that shift values from one extreme to another. How do we use moving averages effectively? More important, which time frames and which set of conditional settings should we employ to give us a true sense or value of the market? We will cover a different concept using a pivot point method later in this blog. Right now, I want to set the foundation behind the principle of why we use moving averages to help determine bullish, bearish, or neutral market conditions and how to trade these conditions. I try to figure out not why a market moved, but rather where the market is now in relation to specific points of interest, such as past opens highs, lows, and closes.
You can see the live performance of WinTrader BUY SELL Signal Software. CLICK HERE to register your details for FREE DEMO
Or Contact our representative in below numbers;
- +91 98466 99177 (English)
- +91 90619 73737 (Hindi)
- +91 90613 80308 (Hindi)
- +91 90613 08080 (Tamil, English)
- +91 92492 73612 (Malayalam)
You can find more information from our blog by click the below links;
- Winners and Losers in Trading Commodity/Share/Currency Markets a Comparison
- WHAT MAKES A SUCCESSFUL TRADER IN FOREX, MCX, NSE?
- TRADERS NEED TO ASK MORE QUESTIONS FOR TRADING IN COMMODITY/SHARE/STOCK MARKETS
- Start Trading in Commodity/Currency/Share Market As a Business with best buy sell signal software
- Brokerage Free Trading in MCX, NSE, BSE segments with FREE Trading Software
- Tips to follow in trading with best technical analysis software
- The Best Technical Analysis Software WinTrader V7.1 Beta Version Released for MCX, NSE, FOREX
- Benefits of WinTrader Buy Sell Signal Software Over TIPS Providers in India
- The Four Psychological State of Emotions to be controlled by Trader in FOREX, MCX, NSE Trading
- The best buy sell signals from WinTrader Trading System V7.0 for MCX, NSE, FOREX
- Why you should become part of financial market as a part time Intra-Day trader in MCX, NSE or FOREX?
- Intra Day Trading Software: WinTrader Buy Sell Signal System in FOREX, MCX, NSE, COMEX
- Become a Professional Trader With WinTrader The Best BUY SELL Signal Software
- Start making serious money in part time by trading in FOREX, MCX, NSE with WinTrader automatic buy sell signal software?
- WinTrader BUY SELL Signal software performance in MCX & NSE
- Why do traders are doing same mistake again in Trading?
- BUY SELL Signal software Your Way to Profit in Trading
- Stress Free Trading With WinTrader BUY SELL Signal sofware in MCX, NSE, FOREX