WinTrader Buy Sell Signal Software Tag: accurate buy sell signal software in India
The best and highly accurate buy sell signal software for MCX, NSE, FOREX, MCX SX, NCDEX, COMEX markets. Take our FREE LIVE DEMO to see the performance.
CLICK HERE to visit our HOME PAGE for more details about WinTrader BUY SELL signal software for Commodity/Stock/Currency markets.
CLICK HERE to register our free demo

Why are traders demanding for scanning facilities in Technical Analysis Software, whether this facility is good or bad for trading success? Making money from trading is not an easy part or get quick rich scheme. Making profit from trading needs proper planning, financial management and proper tool for technical analysis particularly for day trading. But the majority of people who are trading or enter into trading professions with the prejudiced mind of making money from trading is an easy part. Don’t you ever think about that, if making consistent profit from trading is easy, then everyone will be rich in no time? The truth is only 5 to 10% of traders are making consistent profit from trading because of that they are called Professional traders. So what are the specialties in Professional traders that we don’t have to make success in trading? Suppose consider two traders, and two traders have the same technical analysis software to support their trade decisions like entry and exit points. Among those two, one has ended up in total loss and another in continuous profit, and then what will be the secret of second trader’s success. If we evaluate both of them, then we will find out that the secret lies in his financial management and discipline. Now we can look what is the key point in proper financial management and discipline in trade success. The key things to remember or taking in to account for the trade success under proper financial management and discipline are; Selection of segment you are trading like MCX, NSE, FOREX or all Investment allocated for each segment Scrips / Commodities / Currency Pairs selected for trading and the fund allocation to each Describing all these need lots of time and things to convince, but our topic is whether scanning facility is…

Volume and Open Interest Relationship in Trading Commodity, Stock and Currency Market The easiest method to demonstrate the generally acknowledged analysis between volume, open interest, and price action is to construct a table like the one below. Price Volume Open Interest Market Analysis Up Up Up Strong Up Down Down Weak Down Up Up Weak Down Down Down Strong As you can see from the above table, traditional open interest analysis includes four possibilities while in trading financial market like Commodity /Currency / Stock Segments. Prices are going up, and open interest is going up. This means that new money is flowing into the market and there is buying pressure (Do not incorrectly assume there are more buyers than sellers, because there are not. The price rise shows that the buyers are willing to pay higher prices and, of course, the sellers are prepared to cooperate.) This situation is considered bullish. Prices are going up, and open interest is declining. There are comparatively few new buyers, and money is leaving the market. The rally is most likely caused by shorts selling who are giving up and covering their positions, thereby exiting the market. This is often bullish for the short term, because the shorts will normally pay any price to get out, and because they cannot afford to stay in and accept further losses. This action is ultimately bearish. Without new money coming into the market, the rally will fail as soon as the short covering is finished. However, short covering gets to be self-enabling and can last longer than one might suspect. Expert says that the total open interest (meaning the open interest of all contracts combined) always declines five to eight days before the final top. 3 Prices are falling, and open interest is rising. New money is coming into…
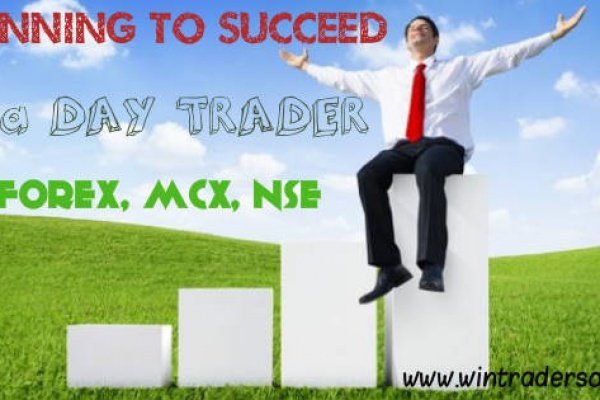
Planning to succeed as a Day Trader in MCX, NSE, FOREX with accurate buy sell signal software Day Traders sometimes presents Day trading as a profitable hobby. Anyone who buys a day trading course via online stating that can make money easily in just a few hours a week, right? Well, no. The fact is that Day trading is a job. It can be a full time job or a part time job, but it requires the same commitment to working regular hours and the same dedication to learning a craft and honing skills as any other job. The best professional day traders have plans for their business and for their trades. They know in advance how they want to trade and what they expect to do when they face the market. They may, at times, find themselves deviating from their plans, due to luck or circumstance or changing markets, but in those cases, they understand why they’re trying something else. Trading comes in many flavors, and many of those who call themselves day traders are actually doing other things with their money. If you know in advance what you want to do, not only will you be less likely to panic or follow fads, but you will also be in a better position to take advantage of opportunities in a way that suits your personality, trading skills, and goals. Planning Your Trading Business The day trader is an entrepreneur who has started a small business that trades in stocks, commodities or currency pairs in hopes of making a profit return. You can get your business off to a good start if you have a right plan for what you want to do and how you are going to do it. With a plan, you know what your goals are and what…
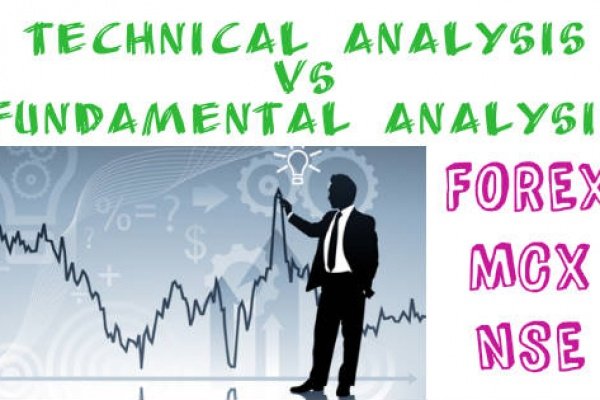
Technical Analysis Vs Fundamental Analysis In Trading In Mcx, Nse, Forex Markets While technical analysis concentrates on the study of market action, fundamental analysis focuses on the economic forces of supply and demand that cause prices to move higher, lower, or stay the same. The fundamental approach examines all of the relevant factors affecting the price of a market in order to determine the intrinsic value of that market. The intrinsic value is what the fundamentals indicate something is actually worth based on the law of supply and demand. If this intrinsic value is under the current market price, then the market is overpriced and should be sold. If market price is below the intrinsic value, then the market is undervalued and should be bought. Both of these approaches to market forecasting attempt to solve the same problem, that is, to determine the direction prices are likely to move. They just approach the problem from different directions. The fundamentalist studies the cause of market movement, while the technician studies the effect. The technician, of course, believes that the effect is all that he or she wants or needs to know and that the reasons, or the causes, are unnecessary. The fundamentalist always has to know why. Most traders classify themselves as either technicians or fundamentalists. In reality, there is a lot of overlap. Many fundamentalists have a working knowledge of the basic tenets of chart analysis. At the same time, many technicians have at least a passing awareness of the fundamentals. The problem is that the charts and fundamentals are often in conflict with each other. Usually at the beginning of important market moves, the fundamentals do not explain or support what the market seems to be doing. It is at these critical times in the trend that these two approaches seem…
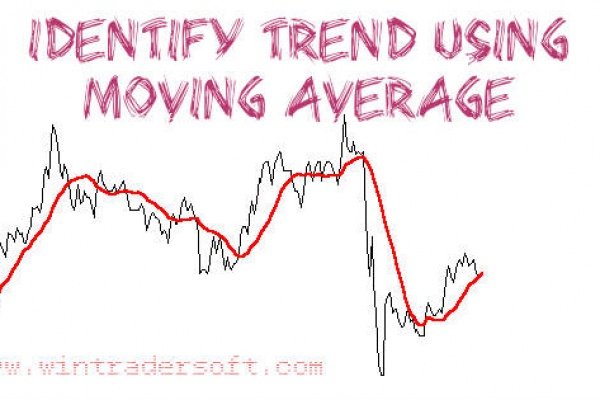
The Basic of Identifies Trend Using Moving Average The basic of Identifies the Trend Using Moving aveage means identifying whether the market is bullish, bearish, or in a consolidation phase is utilizing moving averages. The most familiar one is the benchmark 200-day moving average. Most technicians and short term / day traders feel this is a worthless time period, with which I agree for short- to intermediate term trading. Remember that the idea in using moving averages is to help determine the true direction of the market. The longer the time period used in a moving average, the less effective it is for day trading or short term trading. Keep in mind that a 200-day moving average is over 28 weeks, more than half a year. Those leave way too much time and, more important, distance between prices and the moving average to generate buy or sell signals. When using moving averages the general guideline is simple: If prices are above the moving average, look to buy pullbacks or to take buy signals, as the market is in a bullish mode or in an uptrend. If prices are trading below the moving average, look to sell rallies or to take sell signals, as the market is bearish or in a downtrend. Another instance in which traders use moving averages in helping their trading is determining what is called “regression to the mean.” This is a term many traders hear but really do not understand. It refers to the condition when prices deviate too far from the mean or average. At that time, prices will regress, or return, to the average; or the market will pause or consolidate until the average catches up to the price. You will notice what I call a “gap band” signal. This is what will occur when the…

Comparison of Mind Set in Professional Trader with Amateur Trader We come to the market from different walks of life and bring with us the mental baggage of our upbringing and prior experiences. Professional traders are making consistent profit from trading in Financial Markets like FOREX, MCX, NSE, COMEX, etc but most of us find that when we act in the market the way we do in our everyday life, we lose money. Your success or failure in the market depends on your thought and feelings. It depends on you attitudes toward gain and risk, fear and greed, and on how you handle the excitement of trading and risk. Most of all, your success or failure depends on your ability to use your intellect rather than act out your emotions. So what are the mind set between a professional trader and an amateur trader who starting trading or loosing money in trading, a professional trader has the ability to control his mind while in trading rather than an amateur trader's mind set, a professional trader developed the winning mind set not in a day, its about practice and hard work. A trader who feels overjoyed when he wins and depressed when he loses cannot accumulate equity because he is controlled by his emotions. If you let the market make you feel high or low, you will lose money. To be a winner in the market you must know yourself and act coolly and responsibly. The pain of losing scares people into looking for magic methods. At the same time, they discard much of what is useful in their professional or business backgrounds. The Financial Market is Like an Ocean: It moves up and down regardless of what you want. You may feel joy when you buy a stock and it explodes in…

What makes a Successful Trader in FOREX, MCX, NSE, COMEX Markets? The key elements to making money are this: Successful trader interpret correctly and act swiftly! Successful traders have the courage to act and act promptly. I often ask what the differences between successful trader are and not so successful traders are. I get all kinds of relatively good answers of why traders fail, mainly due to the fact that folks share their own bad experiences with me. The reason I give for success is very simple: Generally, a successful trader does not make a habit of consistently buying the high of a given time period and riding the loss out until it “turns around.” Inversely, successful traders do not make a habit of consistently selling the low of a session and riding that loser out. Successful traders have a plan; they follow the market and go with the flow. After all, that is where the saying, “The trend is your friend,” came from. So we need to determine the trend. That is where WinTrader software helps you to identify buy sell entries and exits in FOREX, COMEX, NSE, MCX, NCDEX, MCX SX markets with its custom coded and powerful indicators system. As Figure 1.1 shows, there are but three states the market is in: bullish, or uptrend; bearish, or downtrend; sideways, Neutral, Choppy or what is known as a consolidation phase. We can see the current trend or conditional state that the market is in. What we can’t see is when and by how much that condition will change. That is one reason why many traders lose they anticipate or guess which direction the market will go; they trade without a plan or set of rules to enter a trade. If you do believe that the markets are an effective mechanism for…
WinTrader, The Best Technical Analysis Software for Commodity /Currency /Share Trading Welcome dear traders; I am very happy that you are here to read this blog about WinTrader, The Best Technical Analysis Software that gives more than 90% accurate buy sell signals currently available in market. I want to give you couple of tips that could help you to make consistent profit from trading in MCX, NSE, NCDEX, MCX SX, FOREX and COMEX Markets with the support of world's best buy sell signals and technical analysis software. The tips are derived in following three categories: Set a Daily Goal for your trading Take Action Be Motivated Set Daily Goal for your Trading You have to pre set the following things to become a successful trader with WinTrader Buy Sell Signal software. How much time you are going to invest in trading on particular day? In which segment and scrips you are going to trade? How many lot you are going to use in one trade? How much income you are expecting in that particular day? In worst case, you have to set the loss that you can afford on that particular day? By knowing all the above means you are well prepared for trading, Take Action By preparing all the above doesn't means you will make profit from trading or you are a professional trader, you need to act. What does this means? You have to pick the perfect buy sell signals with the help of WinTrader Technical Analysis software with the confirmation system, if the generated buy sell signals not confirmed by WinTrader Technical Analysis software you have to wait for the next signals for the confirmed buy sell signals. Once the generated BUY SELL signals confirmed by WinTrader Technical Analysis software you have to take action immediately by place the…
WinTrader V7.1 (beta) Released, The Perfect Technical Analysis Software for Perfect Buy Sell Signals in Commodity/Stocks/Currency markets. After the release of Wintrader V7.0 on August 2015 we are proud to say that WinTrader is now one of the perfect buy sell signal generating and technical analysis software available in market for Commodity/Stocks/Currency trading using by more than 7500 traders all over the world in different financial market in different countries. And thanks for the supports and feedback given from our precious clients around the world, and we valued all our client’s feedback and we tried to update the same with Wintrader, and finally now V7.1 beta version released by resolving some minor bugs that our valuable clients pointed out by our research and development team and we are happy to say that our all clients will get update with the new 7.1 beta version freely as per our life time free update policy. We tried to contact all our clients through email regarding the new beta version release, if the clients are not received the email kindly contact your concerned sales person they will guide you to out tech department to update the 7.1 beta version free of cost. WinTrader currently supports the following financial markets and knows as, The Best Technical Analysis Software for Commodity Segment COMEX (USA) MCX (India) NCDEX (India) The Best Technical Analysis Software for Stock Segment NSE Cash (India) NSE Futures (India) perfectly works on NIFTY & BANK NIFTY NSE Options (India) NIFTY and BANK NIFTY Options The Best Technical Analysis Software for Currency Segment FOREX (International Market) MCX SX (India) And we are adding up more International market to WinTrader Buy Sell signal software and trading systems. What Makes WinTrader V7.1 (Beta), The best Technical Analysis Software gives…

How WinTrader Buy Sell Signal software benefits over TIPS providers for Intra-Day Trading? For look in to this matter, first you need to understand how these TIPS providers are giving TIPS for Intra-day trading call or BTST calls (Buy Today Sell Tomorrow)? Have you ever wonder about this? there are two kinds of TIPS providers, some are genuine and they using pure technical analysis to know the best opportunity to enter the trade of selected stock/commodity/currency pair, and they also look for news for the conclusion in their decision once they confirmed they will deliver the TIPS via SMS to their clients. But some others are only duplicating the SMS to their clients, they will have account with other genuine TIPS providers that we discussed first and when they get the TIPS from them, they will deliver to their clients through their SMS gateway, the client seems the SMS TIPS directly from the genuine TIPS providers while actually not, so without any effort they are making money while the client lose money. How these TIPS providers are using SMS gateways are working, See the below picture for better understanding. From the below picture you will get an idea about how these SMS been delivered to your mobile. In Intra-day trading the timely entry is must, because the market will move fast, suppose you are tied up with a genuine client, and they deliver the TIPS as per their technical analysis, do you think how much time it will take for reach that particular SMS in your mobile. You will get some idea by looking the below image, once a TIP been generated by their technical analyst it will have to gone through the below process until the TIP reach to your mobile. Once the Trade TIP confirmed, they will enter the Trade details…